At Rackslab, we are strongly committed in providing powerful tools that not
only help you manage your IT infrastructure but also give you a clear and
intuitive way to visualize it. In our latest release of
RacksDB v0.5.0, we
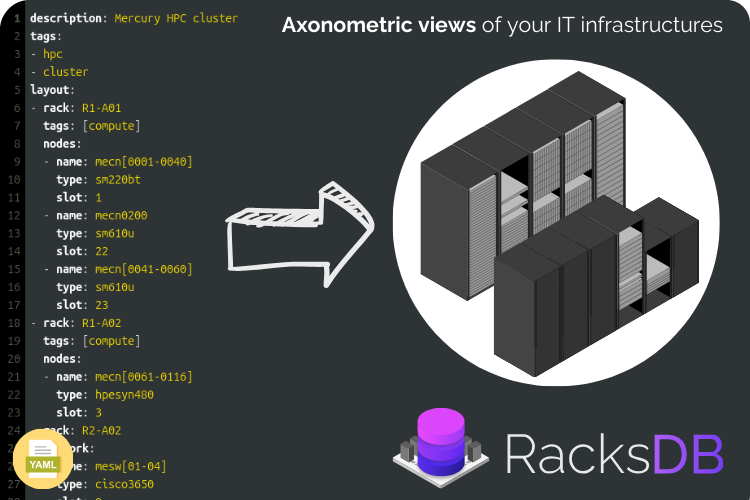
are excited to introduce axonometric graphical representations of your
infrastructure.
In this blog post, we’ll dive into how to use this new feature. Whether you’re
an IT administrator, a data center manager, or a systems architect, this feature
is designed to provide you with a more detailed and easy-to-understand view of
your infrastructure.
Continue reading