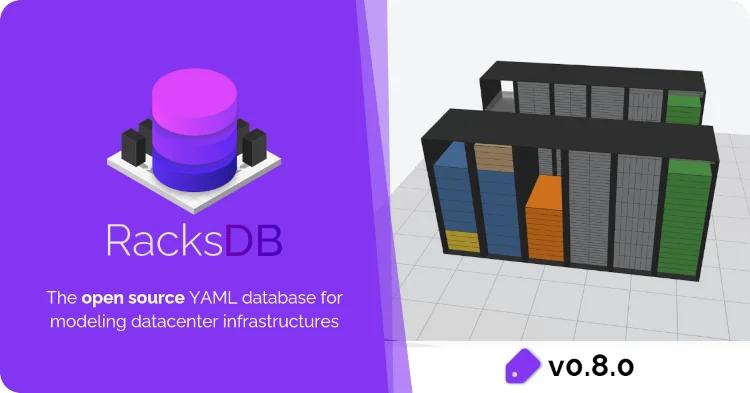
We are thrilled to announce the release of RacksDB v0.8.0! This version brings a major new feature: 3D representations of your datacenter infrastructures, with an interactive 3D viewer in the web UI and export to the open glTF standard.
RacksDB is an open-source solution to model your datacenter infrastructures using simple YAML files.
Your infrastructures in 3D
RacksDB is now able to generate full 3D scenes of your infrastructures, directly from the YAML files describing your datacenters. The scenes contain the racks and all their equipment, placed in their datacenter rooms on raised floors, with perforated tiles in cold aisles.
In the web UI, a new 2D/3D toggle is available on infrastructure details pages. The 3D view is fully interactive: rotate, pan and zoom around your racks to inspect them from any angle. A turntable mode is also available, where the camera automatically orbits around the racks. A perfect fit for a big screen in your operations room!
The 3D scenes can also be generated with the racksdb draw infrastructure
command, the REST API and the Python library, in gltf (JSON) and
glb (binary) formats (see
#164).
A new dimension of possibilities
Beyond the nice visuals, this feature opens many perspectives. The 3D scenes are generated in glTF 2.0, the open and royalty-free standard often described as the JPEG of 3D. This means that your infrastructures can be loaded in a wide range of tools: 3D modeling software such as Blender, web viewers, or augmented and virtual reality devices.
Even more interesting: every node of the 3D scenes is named after the corresponding object in RacksDB (rooms, racks, equipment), with its metadata attached in glTF extras. The scenes are not just pictures, they are structured models that other software can understand and enrich. This paves the way to many use cases:
- Digital twins: Overlay live data on the 3D model of your datacenter, such as monitoring metrics, temperatures, power consumption, or the state of your HPC cluster nodes and jobs, to spot hot spots and failures at a glance.
- Capacity planning: Visualize free space in rooms and racks, and simulate the installation of new equipment before it is delivered.
- Operations and remote hands: Help operators and on-site technicians locate equipment precisely in the datacenter, with an intuitive view that does not require prior knowledge of the room layout.
- Onboarding and communication: Present your infrastructures to new team members, users, management or funding agencies with engaging and accurate visuals.
- Documentation: Get 3D views always in sync with your infrastructures, as they are generated from the same YAML source of truth as everything else in RacksDB.
Conventions of the generated scenes and node metadata are described in the 3D representations documentation page. We are eager to discover what you will build with it!
Collisions detection
This release also improves the reliability of your diagrams with collisions
detection. When drawing rooms, RacksDB now detects racks overlapping other
racks. When drawing infrastructures, it detects colliding equipment in racks,
considering equipment from all infrastructures sharing the same racks. In both
cases, warnings are emitted and colliding items are highlighted with red frames
in the diagrams, making errors in your database easy to spot and fix (see
#8 and
#9). This behavior is enabled
by default and can be controlled with the new collisions
drawing parameters.
And more
RacksDB v0.8.0 also brings a new equipment attribute on racks in the Python
library to list all equipment of all infrastructures in a rack, database files
loaded in a deterministic order on all systems, a fix for racks drawn multiple
times in infrastructure diagrams, and front-end dependency security updates. For the complete list of changes, refer to the
release notes.
For more details about RacksDB, please read its full description.
Ready to try? Follow the quickstart guide!
Useful links: