Release of RacksDB v0.7.0
We are happy to announce the release of
RacksDB v0.7.0, a small
maintenance update with a practical improvement: environment variables to set
default paths in racksdb and racksdb-web.
News and updates
We are happy to announce the release of
RacksDB v0.7.0, a small
maintenance update with a practical improvement: environment variables to set
default paths in racksdb and racksdb-web.

Rackslab announces the release of Slurm-web v6.1.0, a small update focused on practical improvements: enhanced core allocation visuals in the resources page, broader installation and deployment documentation for SLES and related distributions, and a comprehensive set of dependency and security fixes.
Continue reading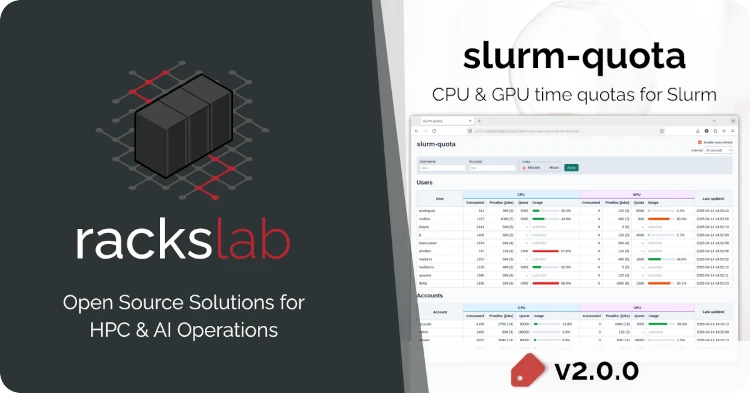
We are pleased to announce the release of slurm-quota v2.0.0, a major update to our open source solution for CPU/GPU time quota management on Slurm clusters. This release introduces a web dashboard and several new administration commands to streamline quota operations.
Continue reading
Rackslab announces the release of slurm-quota, an open source solution to manage CPU and GPU time quotas for Slurm users and accounts.
Continue reading
We are adding official support for Red Hat Enterprise Linux (RHEL) 10 and compatible distributions—Rocky Linux, AlmaLinux OS, and CentOS—for Slurm-web and all of its dependencies.
Continue reading
We’re pleased to announce new official support for SUSE Linux Enterprise Server (SLES) 15 and 16, and openSUSE 15 and 16, for both Slurm-web and RacksDB.
Continue reading