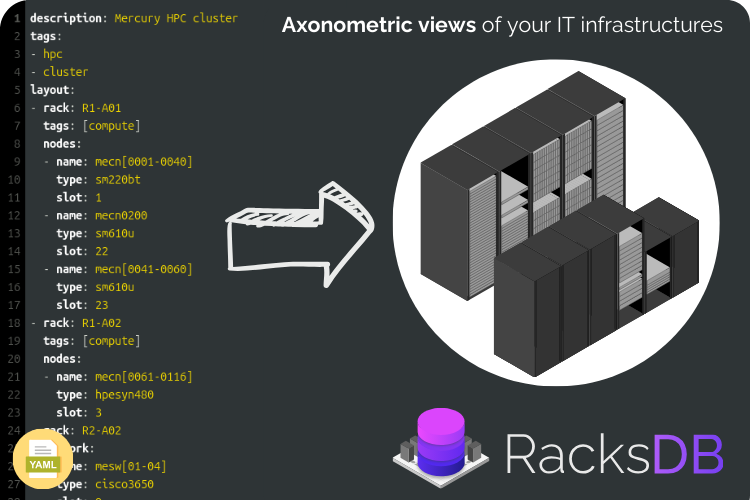
At Rackslab, we are strongly committed in providing powerful tools that not only help you manage your IT infrastructure but also give you a clear and intuitive way to visualize it. In our latest release of RacksDB v0.5.0, we are excited to introduce axonometric graphical representations of your infrastructure.
In this blog post, we’ll dive into how to use this new feature. Whether you’re an IT administrator, a data center manager, or a systems architect, this feature is designed to provide you with a more detailed and easy-to-understand view of your infrastructure.
What is RacksDB?
For those new to RacksDB, it’s an open-source software that helps you modeling hardware resources in your datacenters, with simple schema-validated YAML files. It’s designed to store information about your physical infrastructure, including racks, servers, networking equipment, and much more. RacksDB can produce advanced graphical representations of your IT infrastructure, with seamless integration in other software for real-time visualization.
What Are Axonometric Graphical Representations?
An axonometric projection is a type of 3D representation where the object’s axes are all equally foreshortened, meaning that the angles between the axes are preserved, and the proportions of the object are maintained. Unlike traditional 2D diagrams, an axonometric view gives you a more spatial and dimensional perspective, making it easier to visualize complex layouts.
In the context of RacksDB, an axonometric graphical representation allows you to see your IT infrastructure setup in a three-dimensional organized format. This feature is particularly valuable when managing large-scale data centers or distributed IT environments, where understanding the spatial arrangement and relationship between components is crucial.
Hands-On
Create a YAML file params.yml with drawing parameters to enable axonometric
view:
1---
2axonometric:
3  enabled: yes
And run this command to generate axonometric view of mercury infrastructure:
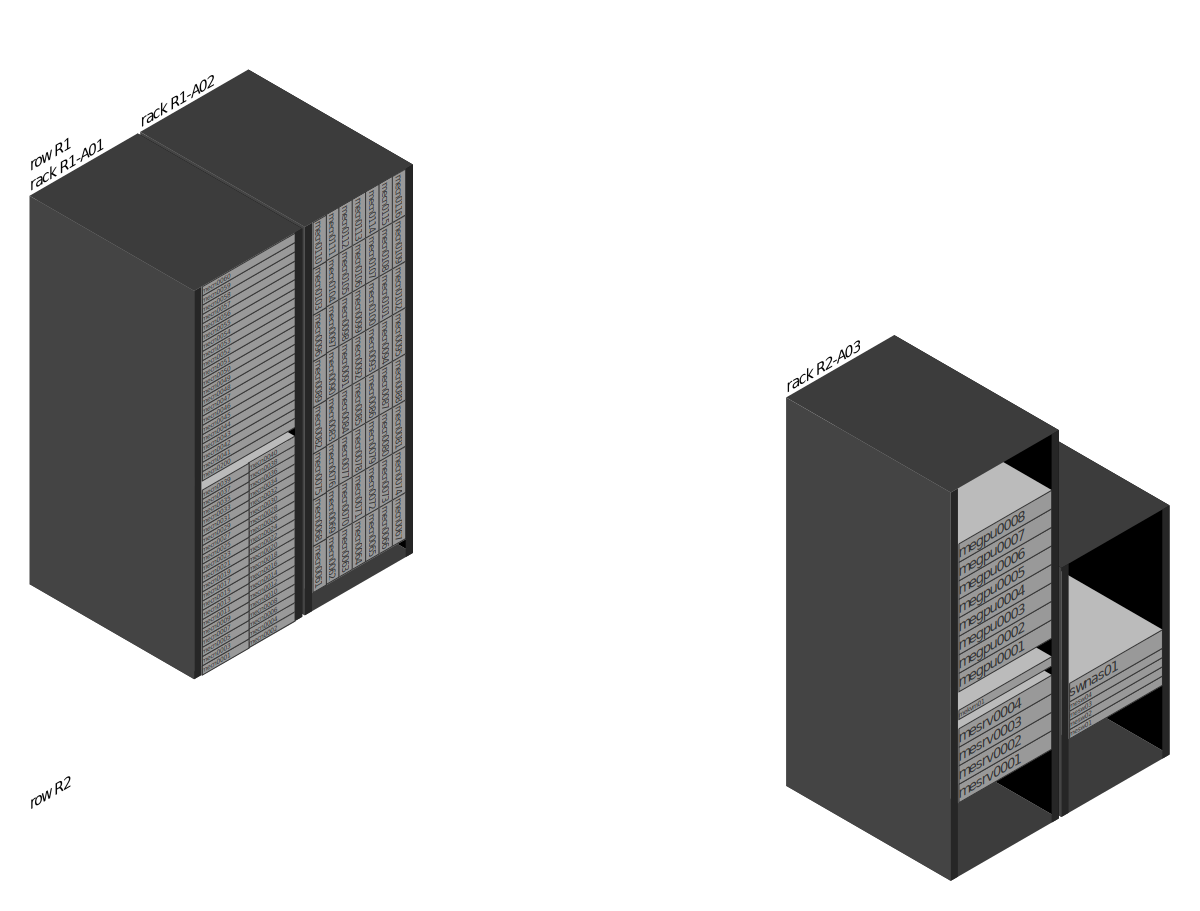
$ racksdb draw --parameters params.yml infrastructure --name mercury
INFO ⸬ Generating axonometric representation of infrastructure mercury
INFO ⸬ Generated image file mercury.png
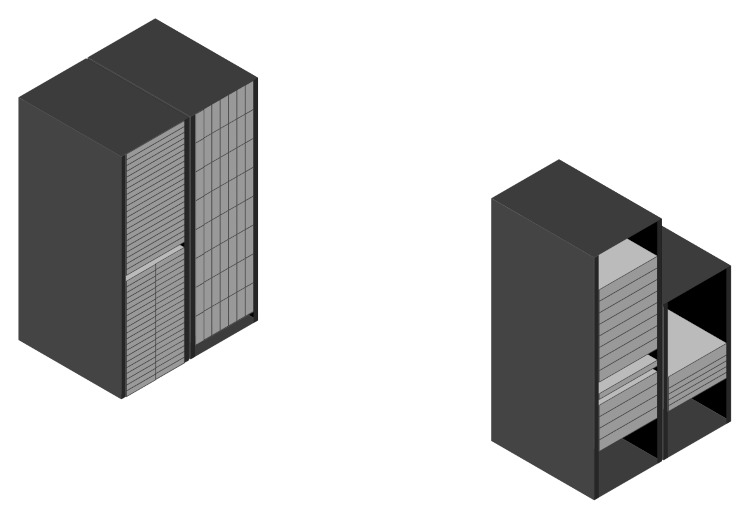
This generates a PNG image file mercury.png representing this:
Formats
By default, RacksDB produces a file in PNG format with maximum width and height of 1200 pixels. This can be changed with additional parameters:
1---
2dimensions:
3  width: 800
4  height: 600
5axonometric:
6  enabled: yes
Also, RacksDB gives the possibility to generate images in SVG and PDF vector formats. For example:
$ racksdb draw --parameters params.yml infrastructure --name mercury --format svg
INFO ⸬ Generating axonometric representation of infrastructure mercury
INFO ⸬ Generated image file mercury.svg
Angles
By default, RacksDB produces isometrics projections with 30° angles on X and Z axes:
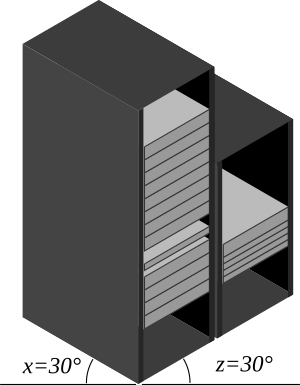
This can be changed with the following drawing parameters:
1---
2axonometric:
3  enabled: yes
4  angles:
5    x: 45
6    z: 45
Labels
By default, RacksDB adds labels on equipment, racks and rows. It is possible to remove these labels with the following drawing parameters:
1---
2axonometric:
3  enabled: yes
4infrastructure:
5  equipment_labels: false
6rack:
7  labels: false
8row:
9  labels: false
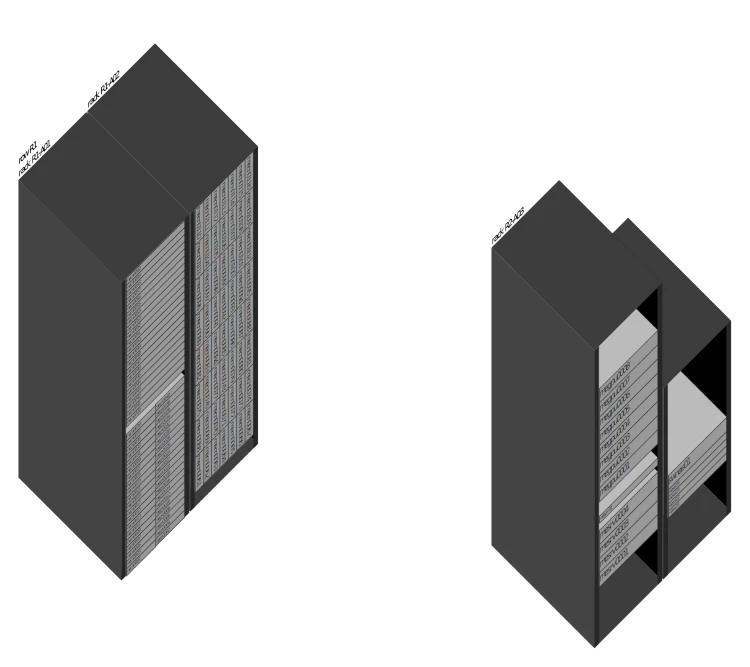
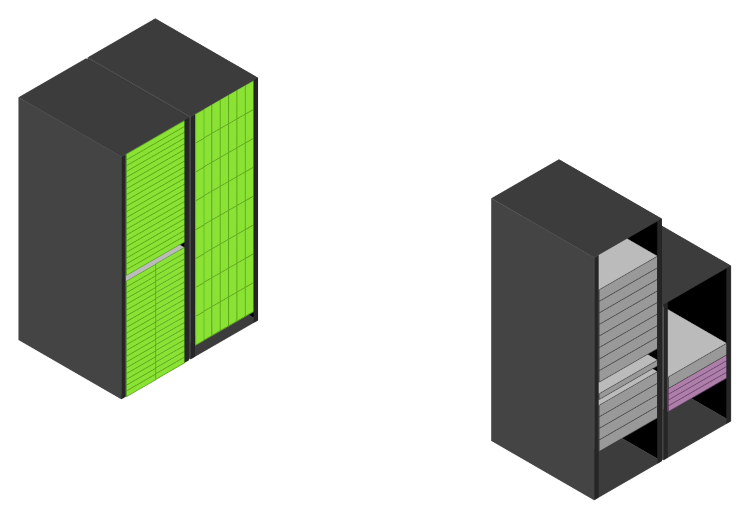
Colors
It is also possible to change color of specific equipment with coloring rules. For example:
 1---
 2axonometric:
 3  enabled: true
 4infrastructure:
 5  equipment_labels: false
 6rack:
 7  labels: false
 8row:
 9  labels: false
10colors:
11  equipments:
12    # equipment with compute tag in green
13    - tags:
14      - compute
15      background: "#8AE234"
16      border: "#4E9A06"
17    # Cisco 3650 switches in purple
18    - type: cisco3650
19      background: "#AD7FA8"
20      border: "#5C3566"
REST API
All these features are also available in
racksdb-web REST API.
First launch racksdb-web:
$ racksdb-web
In another terminal, run this command to send a request:
$ curl -X POST -H 'Content-Type: application/x-yaml' --data-binary @params.yml \
  http://localhost:5000/v0.5.0.dev1/draw/infrastructure/mercury.png --output mercury.png
This produces the exact same image file. With REST API, drawing parameters can also be provided in JSON format. You can refer to official documentation for more information.
Conclusion
Isn’t this feature cool? The introduction of axonometric graphical representations in RacksDB makes easy to visualize your IT infrastructure, with many customization possibilities, from just a few plain YAML files. Whether you’re managing a small server room or massive HPC clusters, this feature provides the clarity and control you need to make smarter, more informed decisions.
Ready to start visualizing your infrastructure in 3D? Follow RacksDB quickstart guide!
Need support? Rackslab offers commercial support and professionnal services for RacksDB (eg. training, features development, etc). Please contact us for more details. You can also ask for help from the community.